Introduction
Trading in financial markets is a complex endeavor that requires a deep understanding of various factors influencing asset prices. Traders rely on a wide range of tools and techniques to make informed decisions, and trading indicators are among the most essential tools in their arsenal. In this comprehensive article, we will explore some of the most powerful trading indicators and examine why they are considered crucial for successful trading strategies. These indicators provide traders with valuable insights into market trends, momentum, volatility, and potential entry and exit points. Understanding their significance can empower traders to make more accurate and profitable trading decisions.
- Moving Averages: The Foundation of Trend Analysis
Moving averages are one of the foundational trading indicators used by traders of all experience levels. They provide a smoothed representation of price data over a specified period, making it easier to identify trends and filter out short-term noise. Moving averages come in various forms, including simple moving averages (SMA) and exponential moving averages (EMA). Here’s why moving averages are considered powerful:
- Trend Identification: Moving averages help traders identify the direction of a trend. When the current price is above a moving average, it signals an uptrend, while a price below the moving average suggests a downtrend.
- Support and Resistance: Moving averages can act as dynamic support or resistance levels. During an uptrend, the moving average often serves as support, while in a downtrend, it can act as resistance.
- Crossovers: Moving average crossovers, such as the Golden Cross (when a short-term moving average crosses above a long-term moving average) and the Death Cross (the reverse), are used to signal potential entry or exit points.
- Smoothed Price Action: Moving averages smooth out price fluctuations, making it easier to identify the underlying trend and reduce false signals.
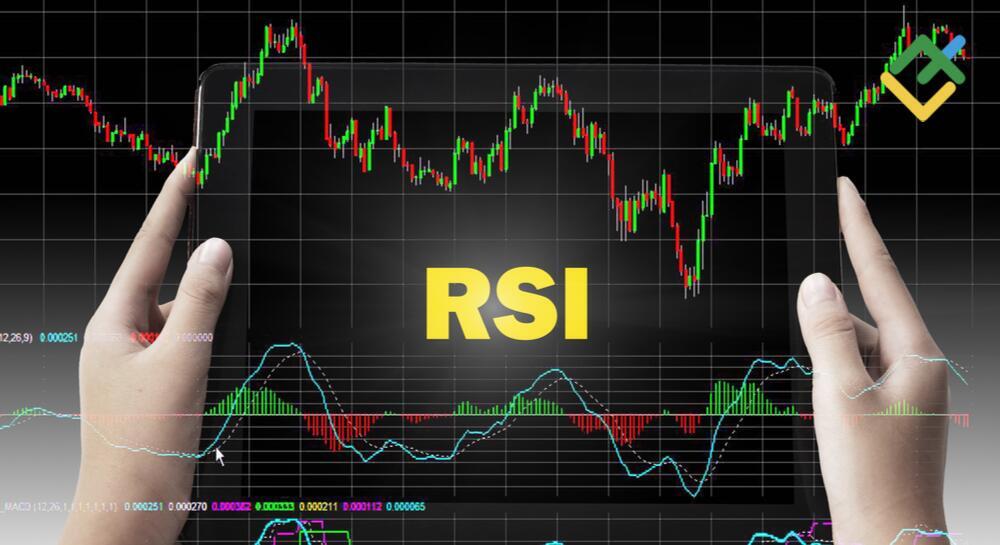
- Relative Strength Index (RSI): Measuring Overbought and Oversold Conditions
The Relative Strength Index (RSI) is a momentum oscillator that measures the speed and change of price movements. It is particularly valuable for identifying overbought and oversold conditions in the market. Here’s why RSI is a powerful trading indicator:
- Overbought and Oversold Signals: RSI values above 70 indicate that an asset may be overbought, suggesting a potential reversal or correction. Conversely, RSI values below 30 indicate oversold conditions, signaling a possible upward reversal.
- Divergence: RSI divergence occurs when the indicator’s direction contradicts the price direction, potentially signaling a reversal. Bullish divergence occurs when RSI makes higher lows while prices make lower lows, indicating potential upward pressure. Conversely, bearish divergence occurs when RSI makes lower highs while prices make higher highs, suggesting potential downward pressure.
- Confirmation Tool: RSI can be used in conjunction with other technical indicators to confirm trend strength and potential reversals.
- Moving Average Convergence Divergence (MACD): Combining Momentum and Trend Analysis
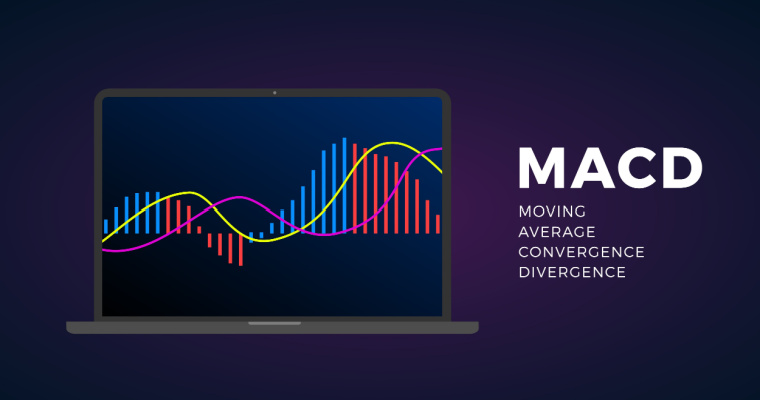
The Moving Average Convergence Divergence (MACD) is a versatile trading indicator that combines aspects of trend analysis and momentum. It consists of two lines: the MACD line (the difference between two EMAs) and the signal line (a smoothed version of the MACD line). Here’s why MACD is considered powerful:
- Trend Following: MACD helps traders identify and confirm trends. When the MACD line crosses above the signal line, it generates a bullish signal, indicating a potential uptrend. Conversely, a bearish cross suggests a potential downtrend.
- Histogram: The MACD histogram measures the difference between the MACD line and the signal line. Positive histogram bars indicate bullish momentum, while negative bars suggest bearish momentum.
- Divergence: Similar to RSI, MACD divergence can be used to identify potential trend reversals. Divergence occurs when the MACD histogram diverges from price action, signaling a potential change in momentum.
- Signal Line Crossovers: Traders often use the MACD signal line crossovers to generate buy and sell signals. A bullish crossover occurs when the MACD line crosses above the signal line, and a bearish crossover happens when it crosses below.
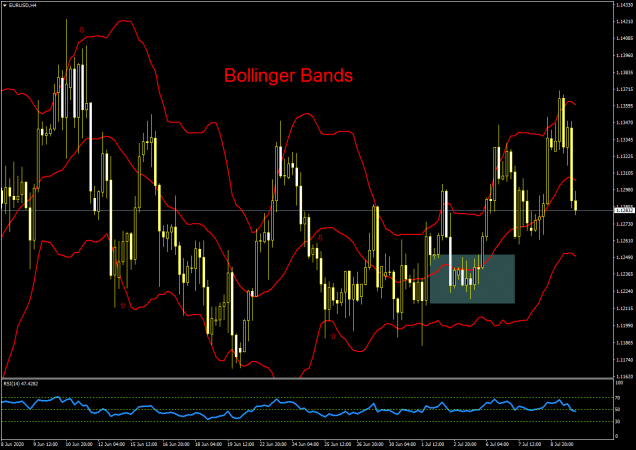
- Bollinger Bands: Volatility and Range Analysis
Bollinger Bands are a volatility-based trading indicator developed by John Bollinger. They consist of three lines: the middle band (a simple moving average), the upper band (the middle band plus two times the standard deviation of prices), and the lower band (the middle band minus two times the standard deviation). Here’s why Bollinger Bands are powerful:
- Volatility Measurement: Bollinger Bands expand and contract based on market volatility. When the bands widen, it indicates higher volatility, and when they narrow, it suggests lower volatility.
- Overbought and Oversold Conditions: Price action that touches or exceeds the upper band may indicate overbought conditions, while touching or falling below the lower band may suggest oversold conditions.
- Reversion to the Mean: Bollinger Bands help traders identify potential reversals to the mean (the middle band). When prices move toward the upper or lower band, there may be a tendency to revert to the middle band.
- Breakout Signals: Breakouts from the Bollinger Bands, especially after a period of contraction, can signal the start of a new trend or a significant price movement.

- Fibonacci Retracement: Identifying Key Support and Resistance Levels
Fibonacci retracement levels are based on the Fibonacci sequence and are used to identify potential support and resistance levels in the market. Traders use these levels to gauge potential price reversals or continuation of trends. Here’s why Fibonacci retracement is a powerful trading indicator:
- Key Levels: Fibonacci retracement levels (commonly 38.2%, 50%, and 61.8%) represent significant price levels where reversals or bounces are more likely to occur.
- Price Corrections: After a strong price move, traders use Fibonacci retracement to identify potential levels where the price may correct or pull back before resuming its trend.
- Confluence with Other Indicators: Fibonacci retracement levels can be used in conjunction with other technical indicators to confirm support or resistance levels and improve trade accuracy.
- Psychological Levels: Some Fibonacci levels, such as 50% and 61.8%, are considered psychologically significant, as they often attract trader attention.
- Stochastic Oscillator: Identifying Momentum and Reversal Points
The Stochastic Oscillator is a momentum indicator that compares the closing price of an asset to its price range over a specified period. It consists of two lines: the %K line (fast) and the %D line (slow). The Stochastic Oscillator is valuable for identifying potential trend reversals and overbought/oversold conditions. Here’s why it is considered powerful:
- Overbought and Oversold Conditions: Similar to RSI, the Stochastic Oscillator provides overbought (above 80) and oversold (below 20) readings. These levels can signal potential reversals.
- Divergence: Stochastic divergence occurs when the indicator’s direction contradicts the price direction, similar to RSI and MACD divergence. Traders use this as a potential reversal signal.
- Crosses and Crossovers: When the %K line crosses above the %D line, it generates a bullish signal, indicating upward momentum. Conversely, a bearish cross suggests downward momentum.
- Momentum Confirmation: Traders often use the Stochastic Oscillator to confirm momentum and potential trend changes.
- Volume: Confirming Price Movements
While not a traditional technical indicator, trading volume is a critical component of technical analysis. It represents the number of shares or contracts traded during a specific time period. Analyzing volume provides valuable insights into the strength and validity of price movements. Here’s why volume is a powerful tool:
- Confirmation of Trends: Increasing trading volume during an uptrend or downtrend can confirm the strength of the trend. Higher volume during an uptrend suggests bullish conviction, while higher volume during a downtrend indicates bearish conviction.
- Divergence: Volume divergence occurs when the volume trend contradicts the price trend. For example, declining volume during an uptrend may signal a potential trend reversal.
- Breakout Confirmation: Traders often look for increased volume to confirm breakouts from key support or resistance levels. Higher volume can validate the breakout’s significance.
- Trading Patterns: Volume analysis is essential for interpreting various trading patterns, such as flags, pennants, and head and shoulders patterns.
Conclusion
Trading indicators play a pivotal role in the decision-making process of traders and investors. While there are numerous trading indicators available, each serving specific purposes, the ones discussed in this article are among the most powerful and widely used. These indicators empower traders by providing insights into market trends, momentum, volatility, and potential entry and exit points.
It’s important to note that no single indicator is infallible, and successful trading often involves combining multiple indicators and tools to form a comprehensive trading strategy. Additionally, understanding the underlying principles and limitations of each indicator is crucial for effective utilization.
Ultimately, the power of trading indicators lies in their ability to provide traders with a systematic and data-driven approach to decision-making, helping them navigate the complex and ever-changing landscape of financial markets. By incorporating these powerful indicators into their trading toolkit, traders can enhance their ability to make informed and profitable trading decisions.